

Quick Apache Log Analytics
Vince Mitchell • August 3, 2016
apache logsNote: This post was originally on .dev
Today I was approached with some Apache log files from the whole month of September and asked if I could help get them to into something that would help visualize them & make them searchable.
After some troubleshooting and configuration I got a Graylog instance up and running, imported the logs using Logstash and kicked it back to the requester.
Given that it took me longer than it might have if there was a guide out there I decided to write one. Hopefully this helps someone out there with a similar task.
Note: This guide outlines my steps using Windows 10. Using a different Operating System may yield different results. The steps in this document are intended for a quick setup for sort term usage. If you intend to setup a Graylog server for extended use this guide is not recommended. As always YMMV.
Requirements:
- Virtualbox
- An Apache log file.
- A need for analytics
- About 30–60 minutes (mostly depending on your internet connection)
Quick Start Download Links:
- Graylog .ova file: https://packages.graylog2.org/appliances/ova
- Logstash: https://www.elastic.co/downloads/logstash
Step 1 — Graylog VM
The first step is to get yourself a Graylog instance. Luckily they provide a .ova file that you can use with VirtualBox.
Navigate to https://packages.graylog2.org/appliances/ova and download the latest .ova file (2.1.1–1 at the time of this writing).
Once you’ve downloaded the .ova you can follow the directions in their documentation located here. The basic steps are to double click the .ova file or choose ‘Import Appliance’ from the ‘File’ menu and select the .ova file.
Once the appliance is running you can login with the default credentials of ‘ubuntu’ for the username and password.
After logging in you will need to set at minimum the admin password using the command sudo graylog-ctl set-admin-password <password> replacing <password> with your desired password.
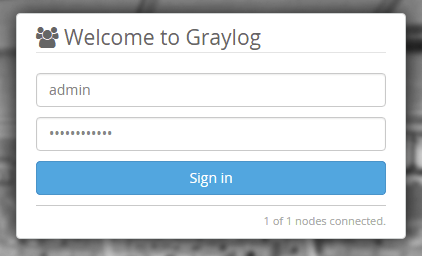
Once you’ve done that you should be able to visit the IP address in your browser and see the login page for Graylog. Login using ‘admin’ and the password you created earlier.
Step 2 — Graylog Input
After you have Graylog running you’ll need to add a input to receive the log entries that we’ll be sending.
Navigate to the System > Inputs in the Graylog menu. You’ll probably see two existing inputs listed, you can ignore those as we’ll be creating a separate one.
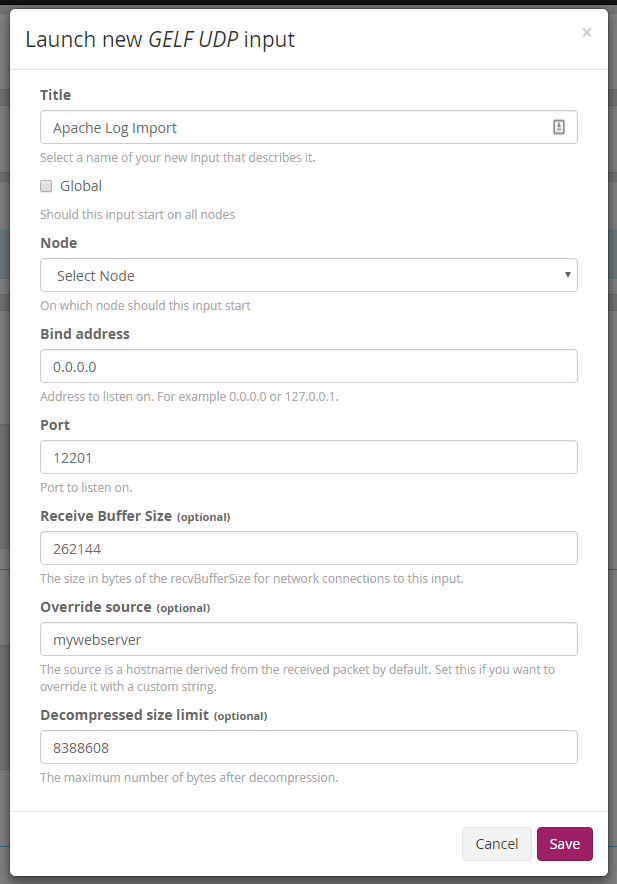
To create the new input select ‘GELF UDP’ from the ‘Select input’ dropdown and click the ‘Launch new input’ button.

A pop up window will appear allowing you to customize some options. We’ll just need to add a title for the input, which can be anything you want.
ASIDE: The other option that may be good to enter is the ‘Override source’ field. This field will change the source name to be something other than what is actually sending the data. For instance all my records showed the source to be ‘VLM’ (my initials) as my computer is named ‘VLM’ and, as you will see later, that is what I used to import the records.
Once you’ve clicked ‘Save’ your input should now be running and we’re ready to send over the logs using Logstash.
Step 3 — Logstash
Download Logstash from here. I used the ZIP version since I am running on Windows.
After the download is complete and you’ve unzipped it you’ll now need to create a configuration file. The following configuration file takes a Apache log file and sends it to Graylog running on IP 192.168.1.111. You’ll need to change the path at the beginning as well as the host IP to match your setup.
input {
  file {
    path => "C:\apache_access.log"
    start_position => "beginning"
  }
}
filter {
  grok {
    match => { "message" => "%{COMBINEDAPACHELOG}" }
  }
  date {
    match => [ "timestamp" , "dd/MMM/yyyy:HH:mm:ss Z" ]
  }
}
output {
  gelf {
    host => "192.168.1.111"
 }
}
Save the above (with your changes) to disk (I saved it to c:\apache.conf). We’ll then need to pass that to the Logstash program we just downloaded. Open a command window and navigate to the unzipped Logstash folder from earlier and enter into the ‘bin’ folder. Once in the bin folder we’ll now start sending our log to Graylog running the following command:
logstash -f c:\apache.conf
You should see output similar to the following:

Your logs will now be sent to Graylog and you can search them and do some analytics!
Check out this page for searching help.
Helpful Tidbits
As I was testing my input to ensure I was getting all the fields correctly I would stop and start the logstash processing. Once I determined all was good I needed to remove all the old messages from Graylog and restart everything. If you need to do the same you can do the following:
The following cURL command will delete the index you are using, and the messages in it. Notice the port is 9200, this is actually deleting from the underlying Elasticsearch software that handles the data.
curl -XDELETE ‘http://192.168.1.111:9200/graylog_0'
Note, the IP would need to change as well as the index (graylog_0). To lookup your indices you can run this in a browser:
http://192.168.1.111:9200/_cat/indices?v
The output should look like this:

Once you’ve deleted the index you can then restart your Logstash command. I did end up changing the name of the file because Logstash would only start back up where it left off. I’m sure there is a way to have it start over but I didn’t take the time to research it.